Data Is Beautiful: 26 Fascinating Graphs and Charts To Teach Us Something New
Check out this batch of graphs, data, and infographics that proves there's a chart for almost anything.
Published 11 months ago in Wow
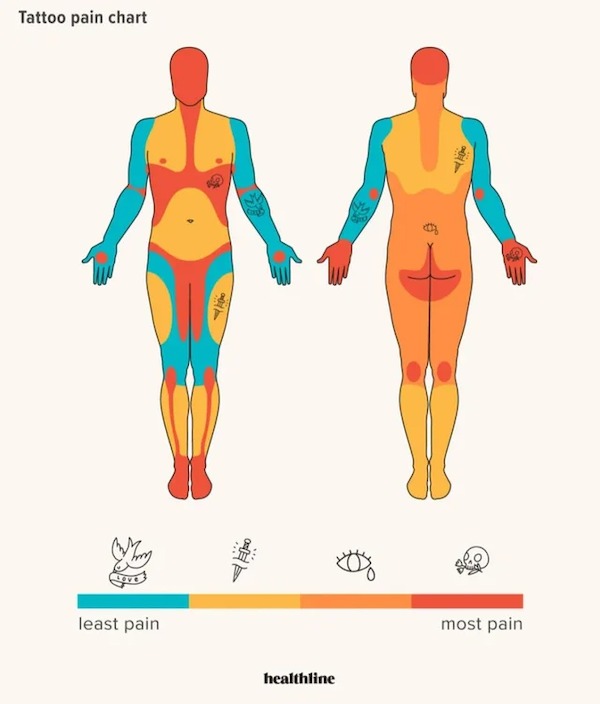
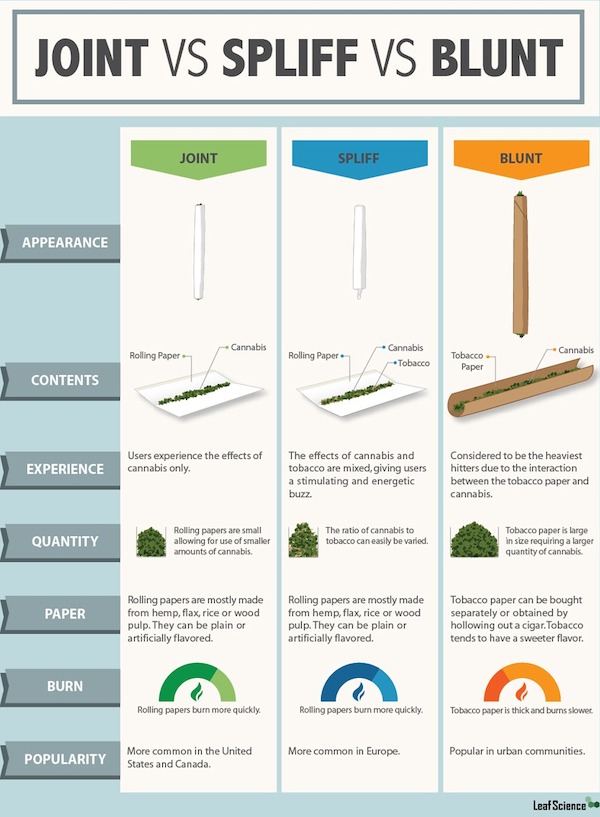
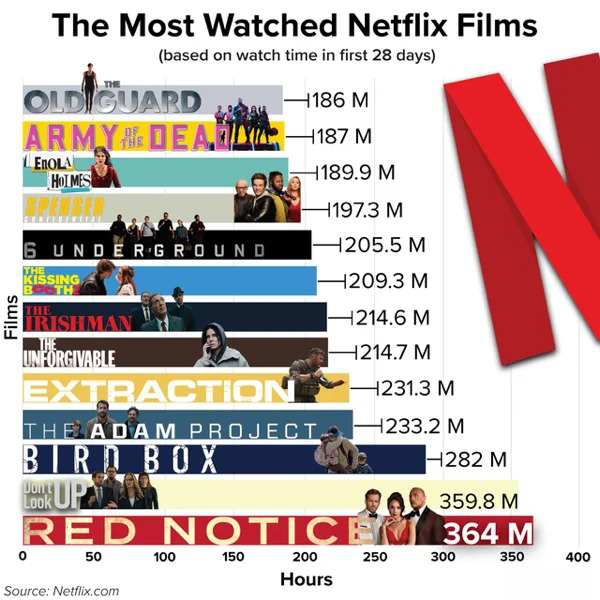
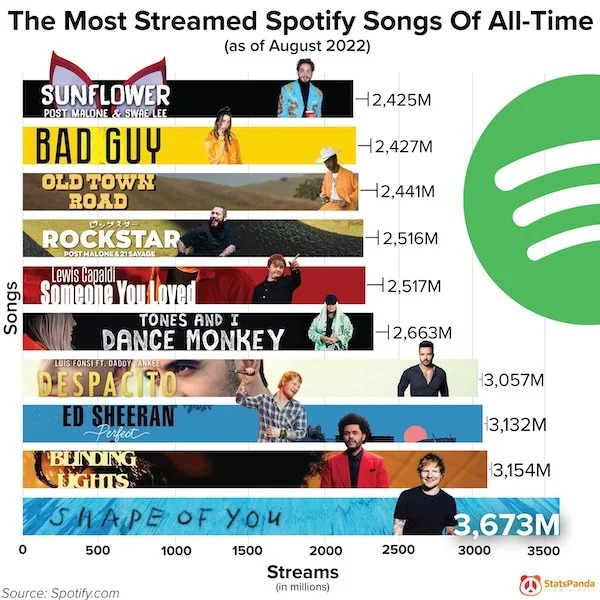
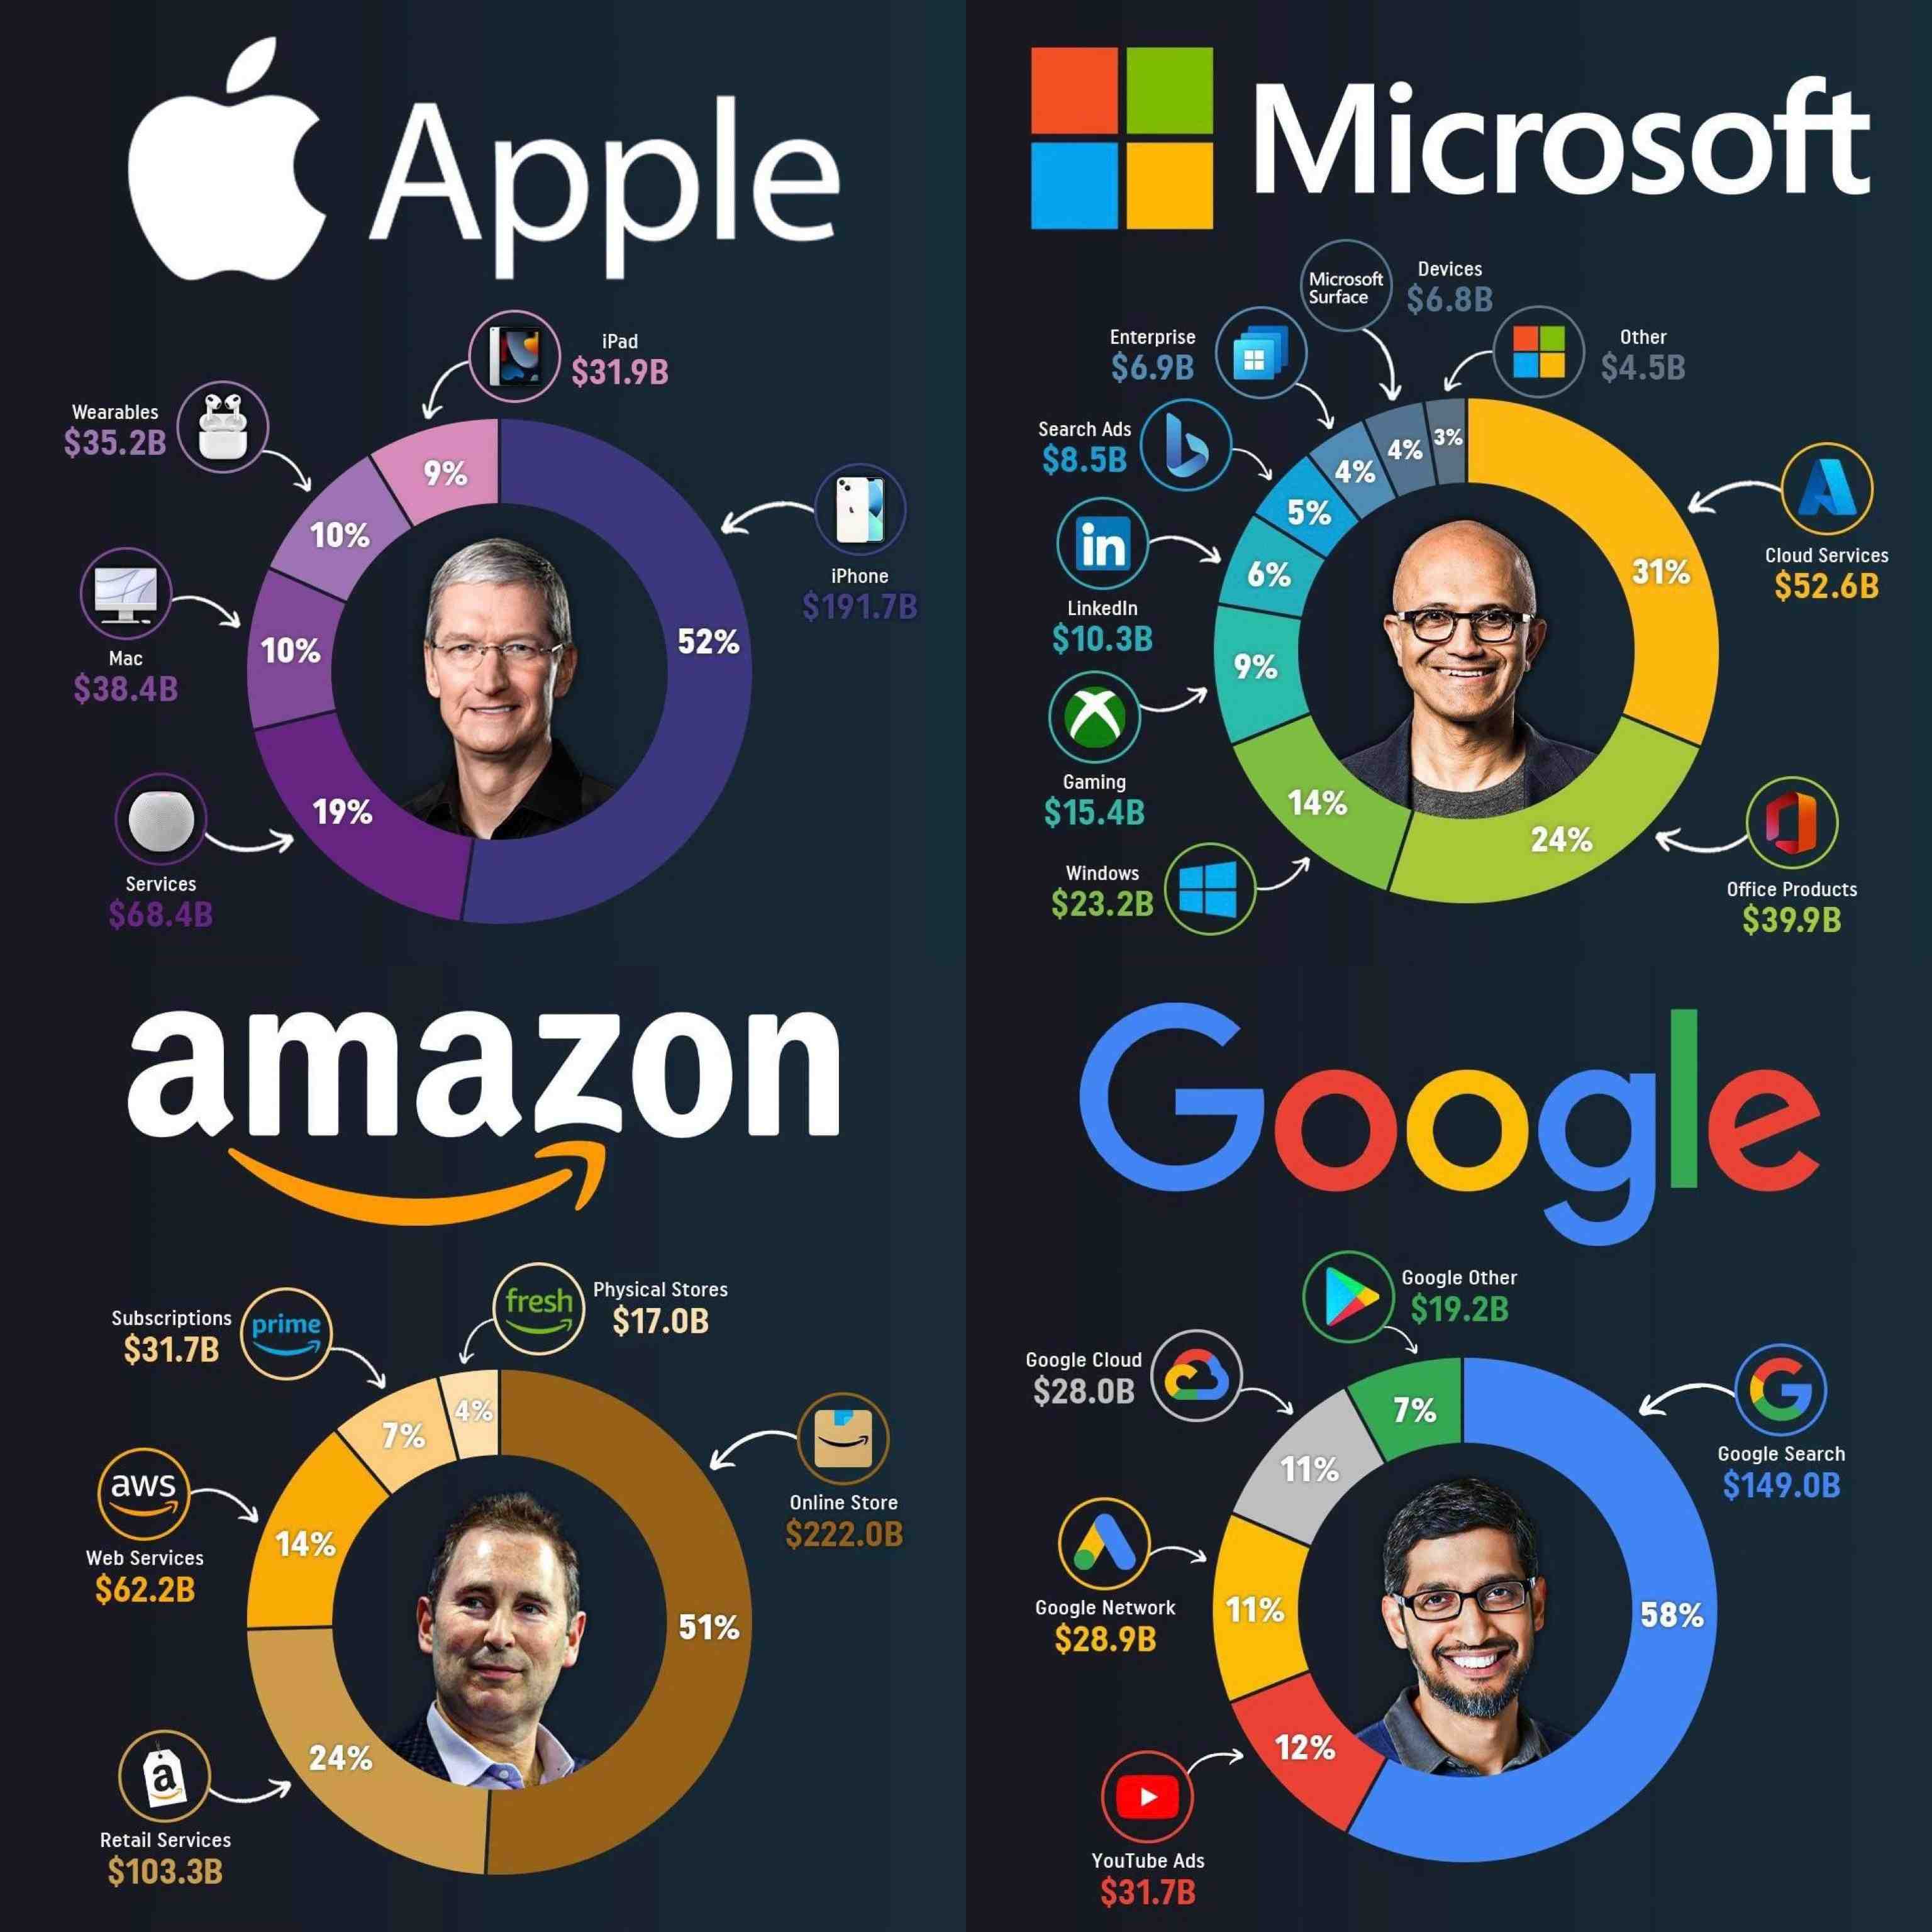
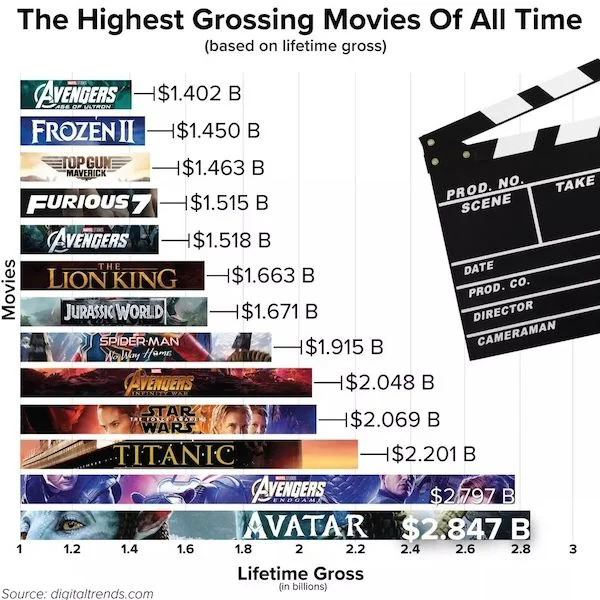
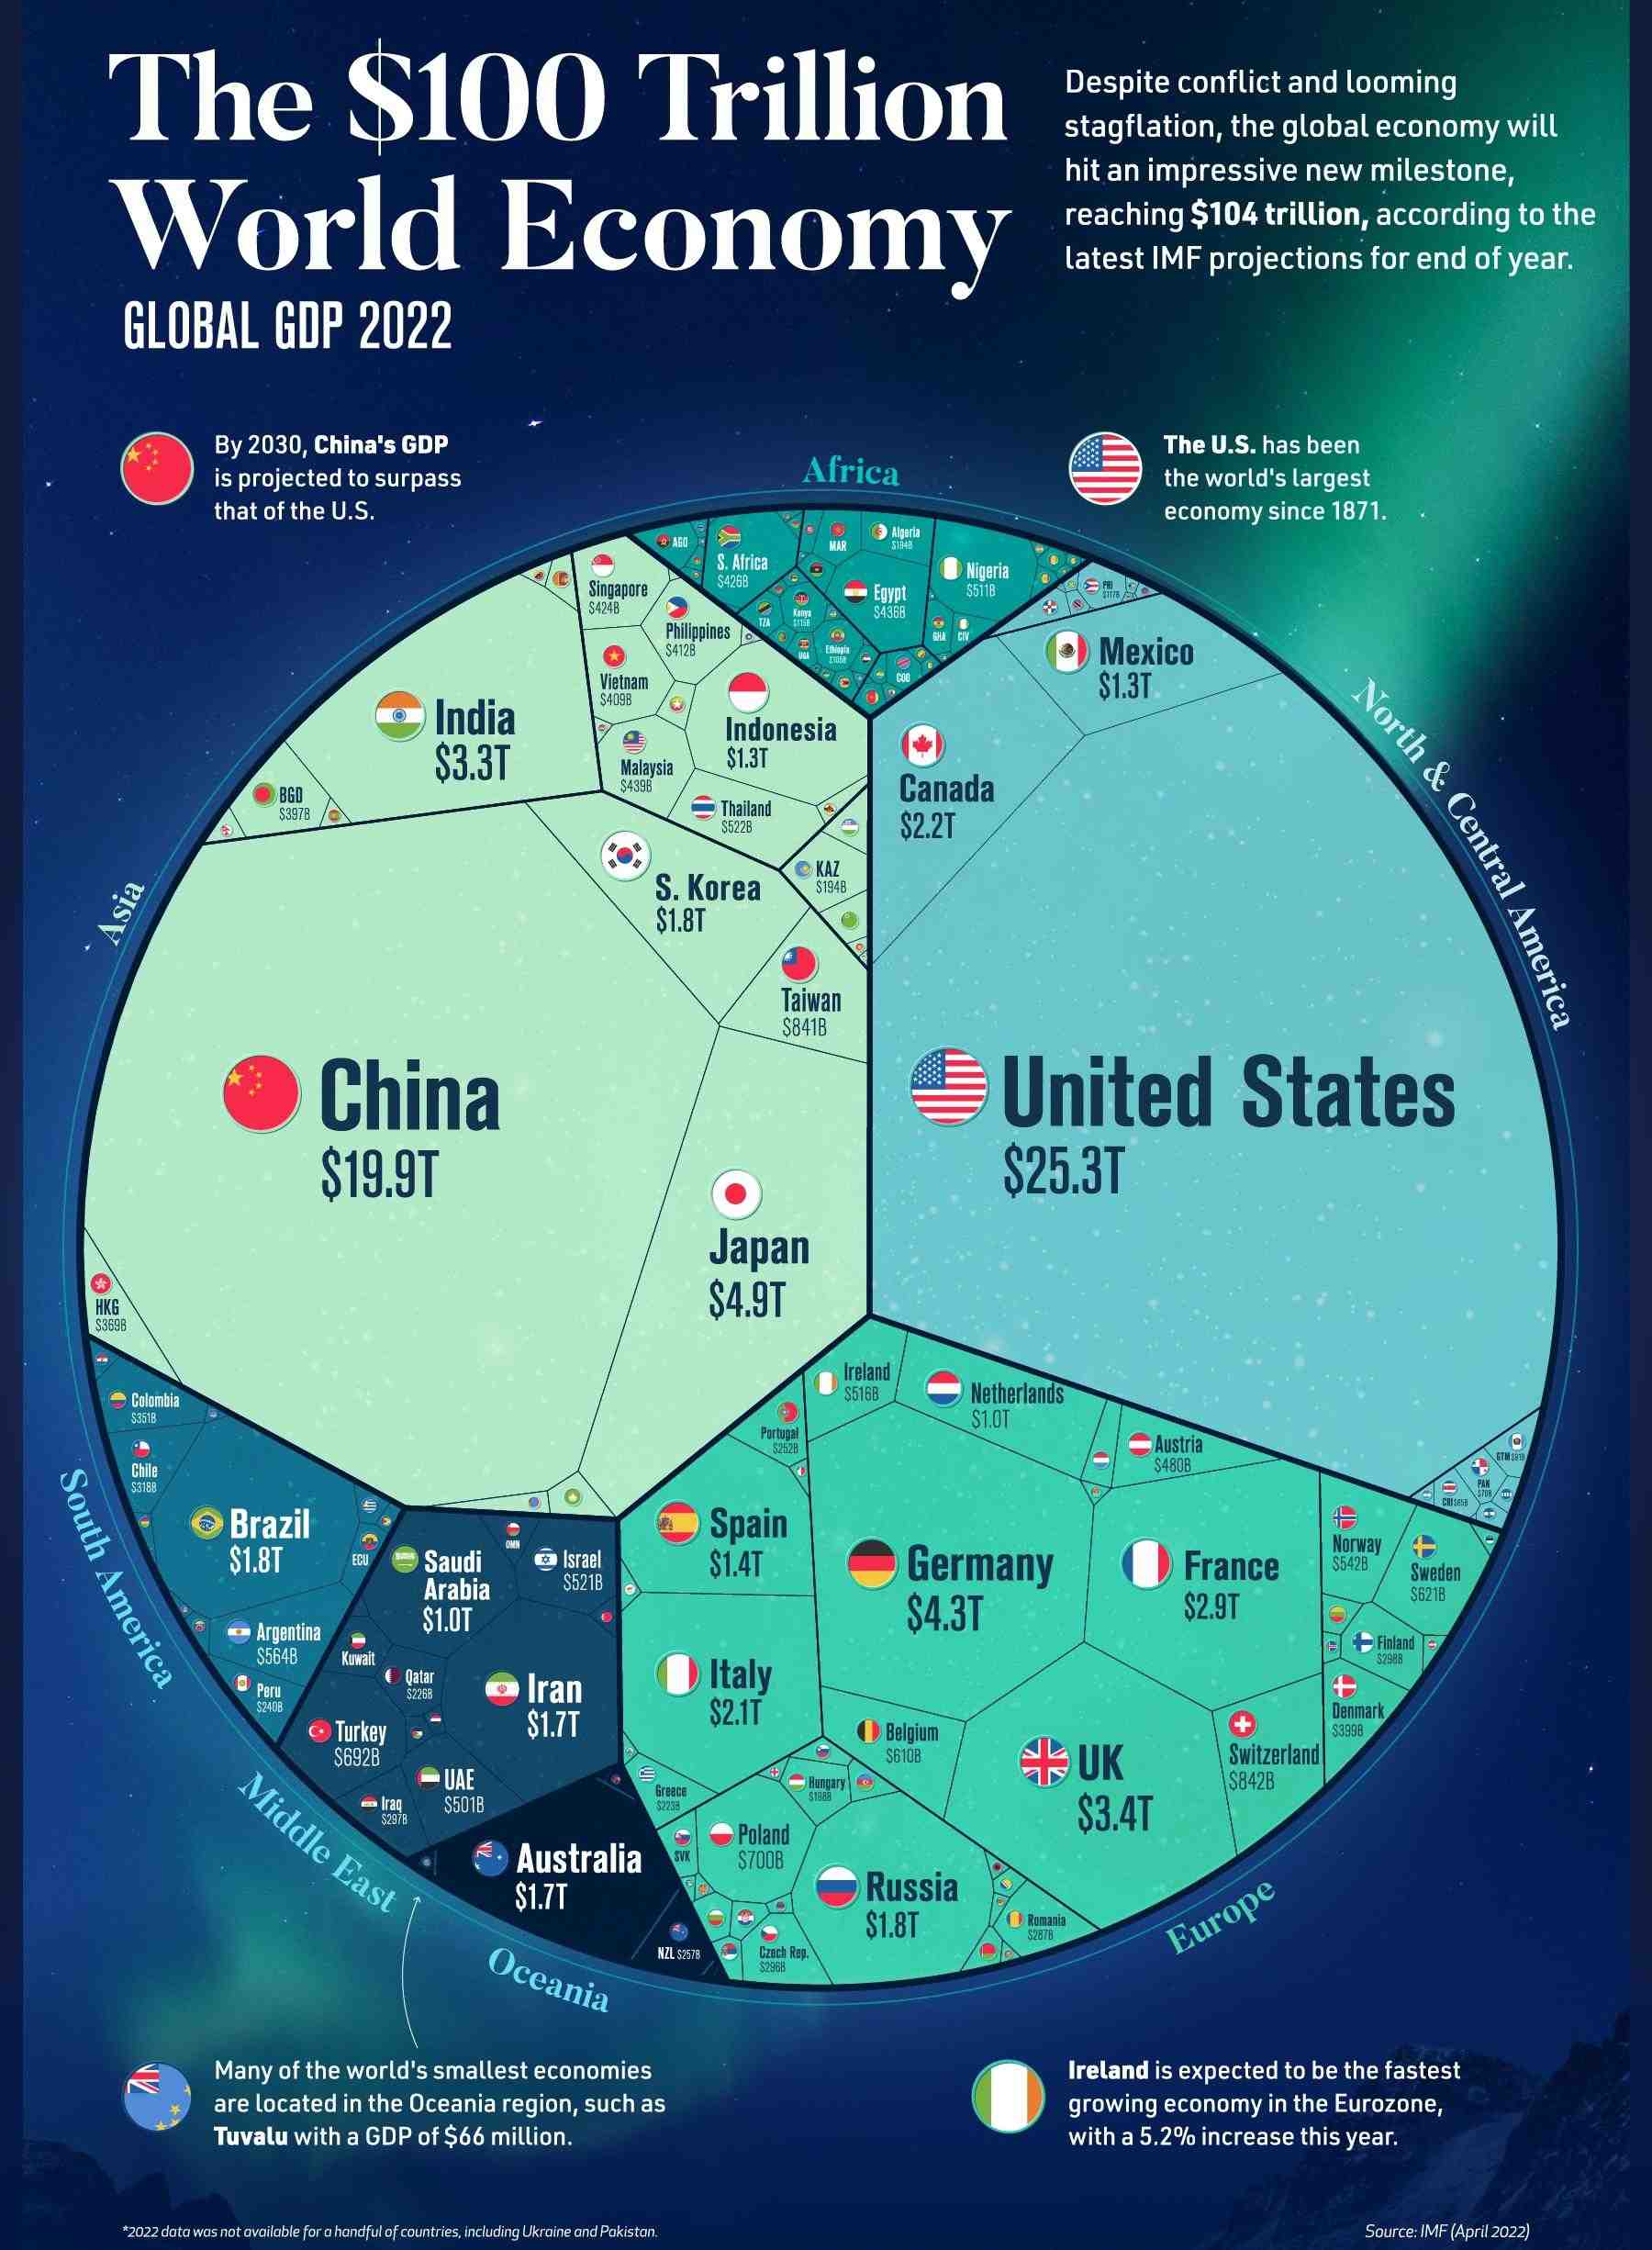
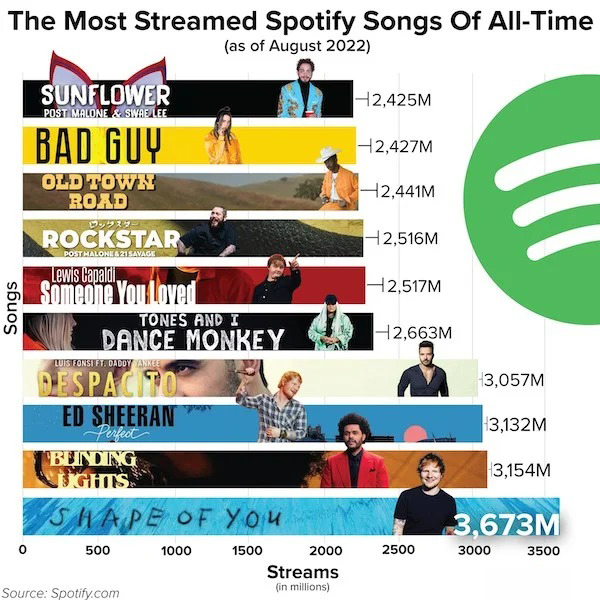
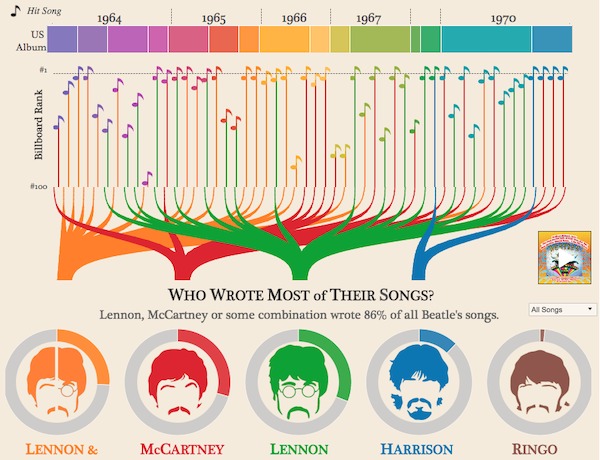
The world has an endless supply of facts, data, and statistics. It can be hard to digest info sometimes when all you have is numbers on a white screen or piece of paper. Visualizing the data in charts and infographics can make it much easier to understand, and more enjoyable to read. Check out this batch of graphs, data, and infographics that prove there's a chart for almost anything.


Most Popular